1/ Select social impact indicators with confidence – a how to guide
How much change has taken place? This is the first in a two-part guide laying out how to quantify a social outcome by selecting reliable and actionable indicators.
The posts should give readers the confidence to select and defend a set of indicators that measure their outcomes. This first section will walk you through the decision-making process of selecting an indicator; then the second half can be used as a checklist for ensuring it is a strong and reliable. In summary:
1. How to select an outcome indicator – this blog
2. Checklist for good outcome indicators – next blog
Indicators should be selected to quantify the most important outcomes you identified when developing a Theory of Change. Go back to that step if you haven’t first mapped your intended outcomes.
After measuring your outcome levels an advance step will be to adjust your outcome levels for impact, or the portion of change you created (sometimes referred to as additionality). I will give guidance on impact considerations in a separate post.
In this post I’m focussing on social capital as an example topic, because in a time of isolation, our social connections matter more than ever. If you are looking for examples of indicators (as I know many people are), watch this site for a future blog with some of the indicator banks I often use for a variety of social impact topics.
How to select an outcome indicator
Indicators are a way of knowing whether (or not) an outcome has taken place.
Typically, indicators are metrics that we track change against, to understand the size or magnitude of an outcome. There are two parts to an indicator we need to get right: the identification of the outcome state (the question); and the measurement of its level (the scale). Guidance on each of these are provided below.
Where will your indicator data come from?
Questionnaires are the best means to gather social indicator data. Social impact practice is founded on the belief that you should engage directly with stakeholders and that they can be trusted to self-report on many social and personal outcomes they experience.
I realise this can be a stumbling block if you have limited resource. Many of my clients groan at the idea of having to contact current and past service users. In that case, it might be better not to quantify your outcomes. One solution could be to embed simple, easy questionnaires into the delivery of your service rather than doing a stand-alone large evaluative data gathering exercise.
Additionally, where appropriate, you can use indirect indicators to infer your outcome. This ladies and gentlemen are where outputs can cautiously be put to use. You can scan your operational data for information you may already be collecting and that could signal the outcome.
For example, new calls to a helpline may indicate recognition of a problem, attendance rates at social coffee mornings might indicate rates of social interaction, or perhaps usage data from an online learning platform may signal awareness. In each case, you should ask how relevant and accurate this output data is to the outcome you are seeking to measure.
Secondary data may also be helpful. To test the effectiveness of a service tackling neighbourhood loneliness you might look at usage patterns of nearby mental health services or rates of single occupancy in homes depending on the nature of your intervention.
It is worth noting before I go on, that economic and environmental outcomes will primarily rely on objective data, which in turn, will be outputs or information gathered from secondary sources. For example, an energy reduction programme will use meter readings to calculate electricity and carbon savings. A programme looking to stimulate income and jobs will use salary and employment rates as indicators. There are more and less reliable ways of gathering such objective data, however the focus of this article (and the next sections) is on social indicators so will not be explored here.
Indicator questions
You have three options when selecting social outcome indicator questions:
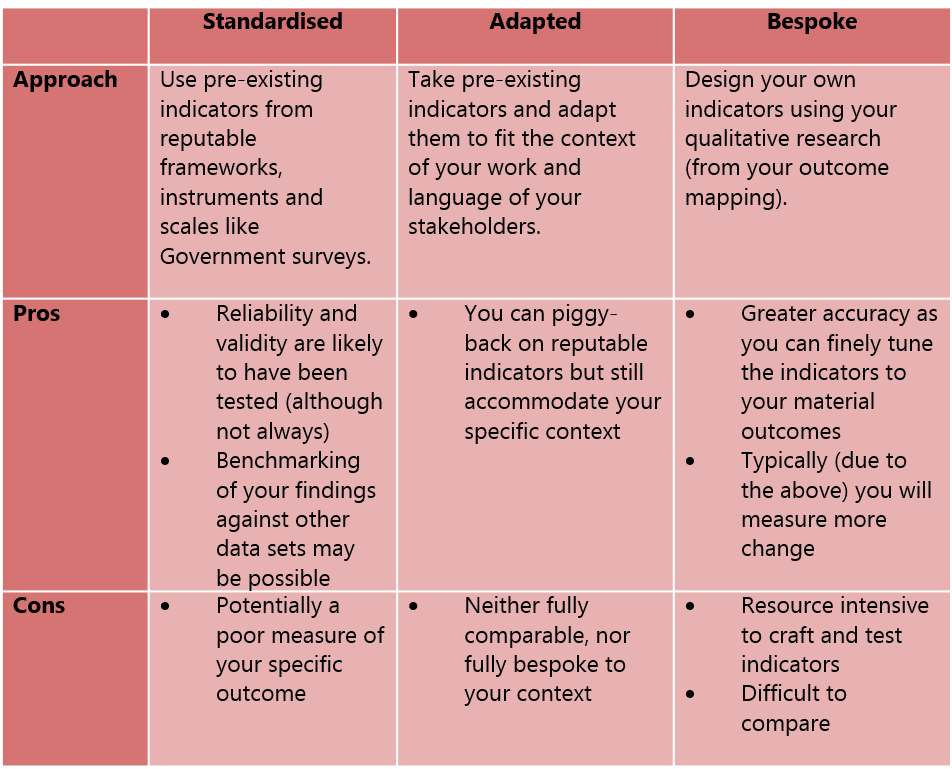
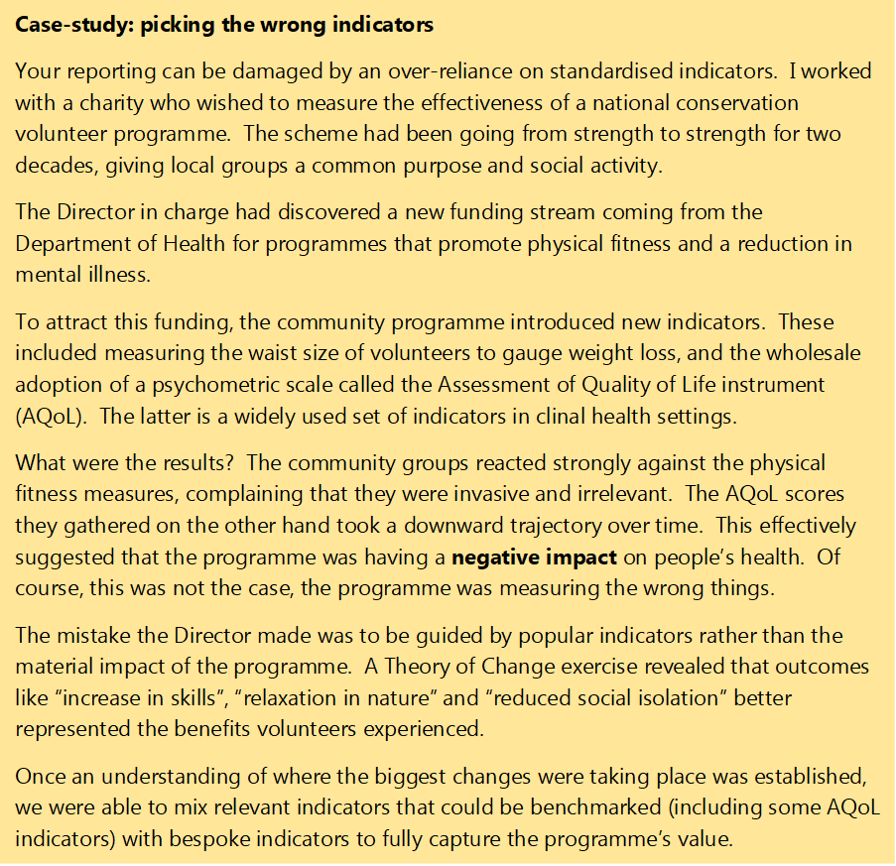
There is a race towards standardisation currently taking place in the impact measurement field. This is accompanied by a lack of confidence to design indicators (the bespoke option) and a disproportionate faith in the quality of pre-existing indicators.
The social impact practice is still evolving. Until unique outcomes have been mapped and defined for all possible social experiences (imagine the ultimate social outcomes framework to rule all frameworks) in my opinion, will still need some bespoke indicators.
Let us explore an example of these three approaches focussing on the quality of peoples’ personal relationships. Imagine we are running a mothers’ group for women experiencing post-natal depression. We are looking for an indicator that will tell us if attending the group has improved women’s feelings of being supported and understood.
Here are six options for standardised indicators, from the ABS General Social Survey, Australian Unity Personal Wellbeing Index (PWI) and the European Social Survey:
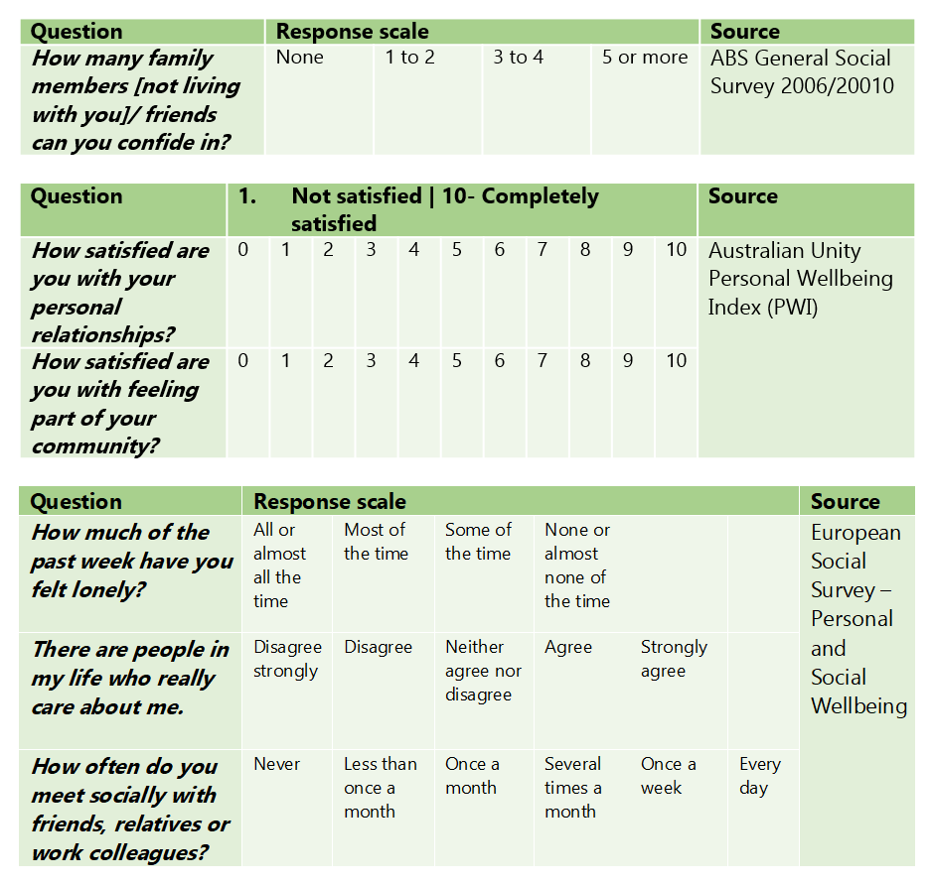
Looking at the six indicator questions, which do you think best fits the outcome of feeling supported for women experiencing post-natal depression? Perhaps the loneliness indicator from the European Social Survey and the having friends and family to confide in from the ABS General Social Survey would touch on the specific experiences of isolation that new mothers can have.
Overall, all six are good options, but most of them suffer from being too general to capture the specific change relating to our intervention. For example, a woman may have many people whom she feels she can meet or confide in, but not about her motherhood anxieties.
We could take our two favoured indicators and adapt them to better represent the experiences our intervention. For example:
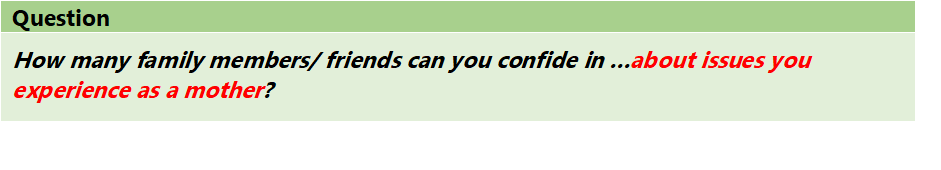
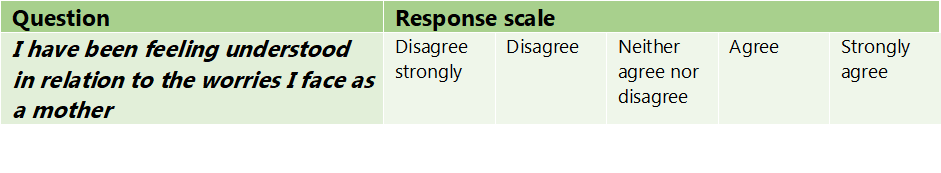
Finally, we could select our own bespoke indicator by listening to the experiences described by women attending the group. Perhaps they mentioned the weight of their worries being lifted by meeting other people who could fully empathise with their experiences leading us to create an indicator like:
Indicator scales
“There are three kinds of lies: lies, damned lies, and statistics” – Sir Charles Dilke
In social impact research we are measuring outcomes. Outcomes mean a change. To determine whether a change has taken place we need to know what the baseline level of the outcome was, and where it ended up.
It is still common to see binary indicators in social impact studies. Binary indictors are where you ask whether an outcome has taken place: yes or no? The problem with binary indicators is that you cannot quantify the level or amount of outcome that has taken place. It was either 0% change or 100%: they are a blunt instrument.
This can result in over-claiming. For example, if you ran an afternoon event and then asked if it had improved attendees’ relationships, they are likely to respond yes. If you placed a homeless young person in a special care home for a year and gave them the same survey, you would probably also measure the same improvement in relationships (100%).
Binary indicators do not tell you how much or for how long the outcome lasted. This matters if you want to improve what you do, and it will really matter if you plan on attaching a monetary value to an outcome (later in your analysis). It is best practice therefore to use a scale so that you measure the amount of movement (hopefully positive) that an individual traveled along a scale.
As you can see in the indicator examples in Figure 3 above, there are various factors to play with when designing your scale:
· Short vs. long. Short scales, for example with three points, are less sensitive to small changes and/or can lead to overclaiming. Long scales, for example with 11 points (as shown in the Australian Unity PWI) can be difficult for some people to hold in their heads and are not recommended for telephone surveys and people with learning difficulties.
· Even vs. odd numbers on a scale. Even numbers force respondents to express an opinion one way or the other, odd numbers allow respondents to sit in the middle.
· Defined scale vs. undefined. In a defined scale, each point along the scale is specified (for example in the ABS indicator) and this can be extended into sentences if you want to control how people interpret each point. For example, returning to our European Social Survey question on people who care about me: “agree” could instead say “there are some people who care about me, but I cannot talk to them about things that really matter”.
Once you have a scale in place there are two common ways of analysing the indicators:
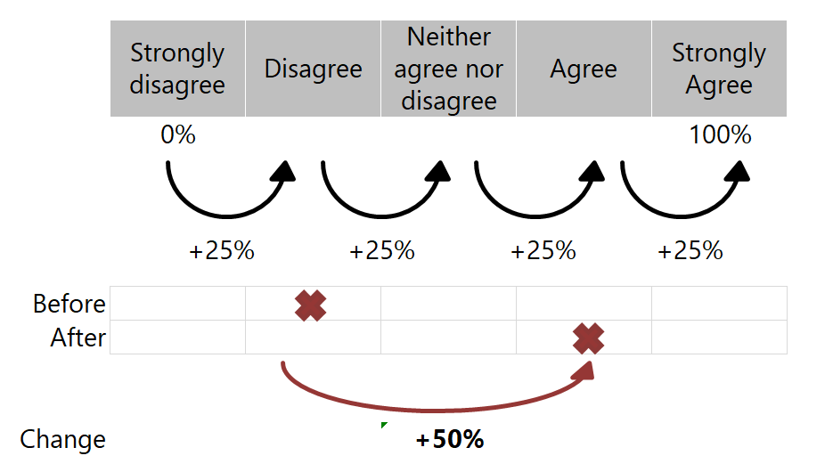
1- Average percentage change: this approach converts movements along scales into percentage changes. It calibrates the maximal possible outcome state as 100% and the minimum point as 0%. The calculation approach is illustrated below in Figure 6.
The benefits of this approach include that you can monitor subtle improvements (or declines), you can harmonise different scales and you can accurately convert outcome levels in valuations (later in your analysis). The disadvantage of percentages is they can be difficult to communicate in isolation, as they involve a little more explaining.
2- The number of people experiencing the outcome. Alternatively, you can set a threshold level of movement along a scale to count the outcome as having taken place. For example, an individual must positively jump two points on a scale or move from a disagree to an agreement point. You can then analyse the percentage of individuals who achieved the outcome.
Some general advise with scales:
· use at least four or five points for written questionnaires
· aim for consistency across indicators: for example, if you can use a five point strongly agree to strongly disagree likert scale for most of your indicators then do that
· keep it simple: only design new defined points on the scale if you really need to. There are plenty of tested likert response scales you can use, here is a useful selection.
Final thoughts: how to select an outcome indicator
Indicators should be chosen or designed once you have a Theory of Change or logic model. Questionnaires are the most common ways of gathering information on social outcomes. You can either: (i) use indicators that are standardised in these questionnaires, or (ii) you can adapt existing indicators to better suit your context, or (iii) design bespoke indicators from scratch.
Take time to craft the right indicator question and multi-point scale to capture the change. Test your indicators with some stakeholders, especially if you have adapted or prepared some bespoke indicators.
I find coming up with the right indicators hard work and you probably will too. The sophistication in this exercise comes from producing something so simple that it looks easy.