Impact: how to calculate your additional value
What is your contribution to change? What slice of the pie is yours?
In Social Value practice we regularly use three impact concepts to help calculate your share of any outcomes. This post summarises what they are and how to apply them.
What is impact?
Impact in Social Value practice refers to the amount of additional change you have generated. It is the change that would not have occurred in the absence of your work. Or put another way, it is the portion of value that is caused by an intervention.
This is a more precise use of the word impact than you are likely to see in other evaluation practices where it often just refers to long-term change. The conceptual clarity is useful because cause-and-effect considerations are normally missing in general outcomes measurement.
Approaches to estimating impact
A clean approach to estimating impact is to use a good control group selected as part of a randomised control trial. The difference between the outcomes experienced by your stakeholders (receiving a treatment or intervention) and your control group (stakeholders not receiving a treatment) will provide you with your impact. For example, the wellbeing and academic outcomes experienced by a group of children entering an innovative foster care program could be compared to a group of children who did not participate in the foster service.
Unfortunately, randomised control trials are never as squeaky clean as evaluators might have you believe. Returning to our example above of the foster care program, what characteristics would need to be consistent between the treatment group and the control group to make them a reliable comparison? Family history, prior experience of the care system, type of school they attend, age, where they live and even genetics will all play a role in influencing these children’s outcomes.
Randomised control trial sizes are intended to mitigate the variation you might see between your treatment and control groups. But even then, there are ethical questions around knowingly depriving a group from a beneficial intervention or treatment. Constructing a control study is therefore beyond the means of most small services and community projects. Luckily there are other helpful ways for us to estimate the counterfactual.
Social Value practitioners use three elements to assess impact. Once you have measured the size of the outcomes that have taken place, you can then take slices out of that pie to account for these three aspects of the counterfactual. The concepts we use are:
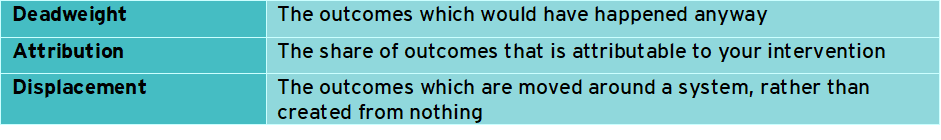
Let us look at each in turn and describe how to apply them in your impact calculations.
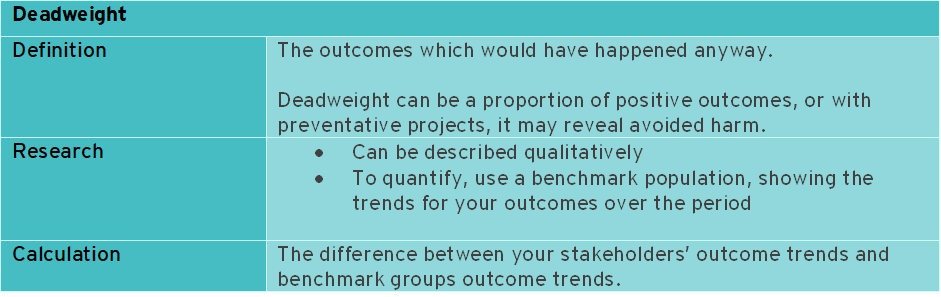
Deadweight
Deadweight is the level of outcome that would have occurred regardless of your intervention; or the amount of change that would have happened anyway.
How do you determine what might have happened to your stakeholders if your work did not exist? A simple way is just to ask your stakeholders. Qualitative data can be used to create a visual narrative, perhaps with multiple possible pathways that your stakeholders could otherwise have taken.
For example, if women did not receive help at a refuge, they may otherwise have remained with an abusive partner, or they may have moved in with other family, or they may have ended up homeless. You can ask stakeholders to rank the likelihood of each pathway and use this to describe the difference of your service.
If you would like to put a number on the deadweight, you will need a comparison indicator or benchmark. This benchmark should relate to the characteristics of your participants as closely as possible.
The comparison indicator may come from government data that can provide you with outcome trends either locally or nationally for a similar segment of the population to your stakeholder group. For example, you may look at ABS data on employment rates, crime trends or neighbourhood indicators of deprivation over time. Alternatively, you may find useful benchmarks from other research organisations or from social programs themselves.
Remember you are looking for trend data, so either a change from one point in time to another or multiple data points from successive years. Comparing your outcome data, which will represent a change to a static point-in-time percentage is a very common pitfall when using deadweight benchmarks.
Once you have your deadweight, it should be deducted from your measured outcomes (removing a slice of the outcome pie). The exception is when your initiative prevented a harm (a prevention program), in which case it should be added to your measured outcome level. The harm you prevented is an invisible outcome so you would not have been able to gather direct data on it.
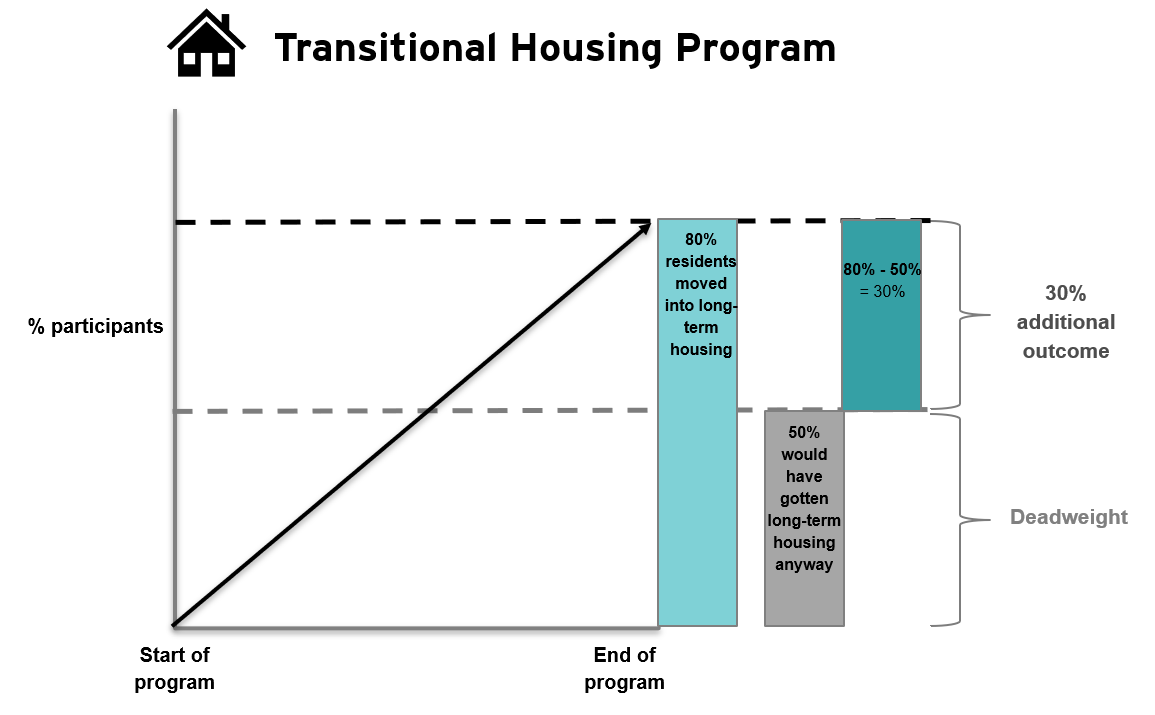
Deadweight is most easily handled as a percentage. For example, you run a transitional housing program that aims to get people into secure long-term housing. You do this by supporting people to deal with the needs that left them in housing crisis.
After six months of support, 80 per cent, or eight out of every ten participants, have secured long-term housing. However, the national rate of people in housing crisis receiving long-term housing is 50 per cent or one in two during the same period. The national benchmark must therefore be subtracted from the outcome you measured. This leaves you with an outcome additionality of 30 per cent (see chart below).
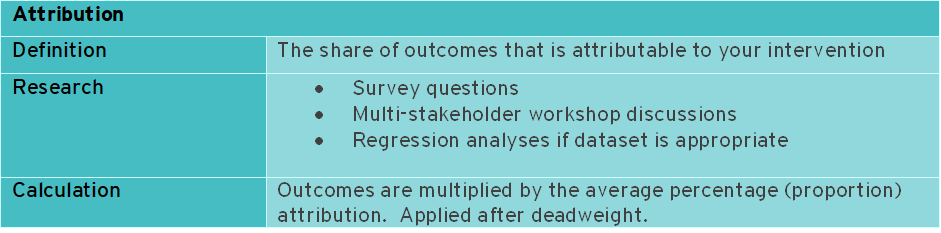
Attribution
Attribution is the portion of outcomes that your intervention can take credit for. It is applied to the outcomes after you have accounted for deadweight.
Further influences on outcomes could be other services, individuals like family members or even something about individual’s circumstances like their health or financial resources. These influences are usually specific to your stakeholder group (perhaps they are refugees in housing crisis) and therefore are unlikely to be captured in the more general deadweight you used (for example the national rate of long-term housing placements).
Estimating the amount of attribution to each factor is not an exact science. In the absence of a complete dataset for performing causation analyses (like a regression analysis), we simply ask stakeholders to estimate the attribution to each factor.
I think this is most clearly illustrated with an actual survey question. Using the example of our transitional housing program, the stakeholders who experienced the outcome of moving into long-term housing might be presented with a survey question such as the following:

In the example above, the survey prompts the respondent to think of other influences on their outcomes. This is good questionnaire design because it enables the respondent to consider wider influences. You may have identified other influences as part of the “external factors” in your Theory of Change research.
Other approaches could include stakeholder workshops where various service providers describe their contributions and debate their influence.
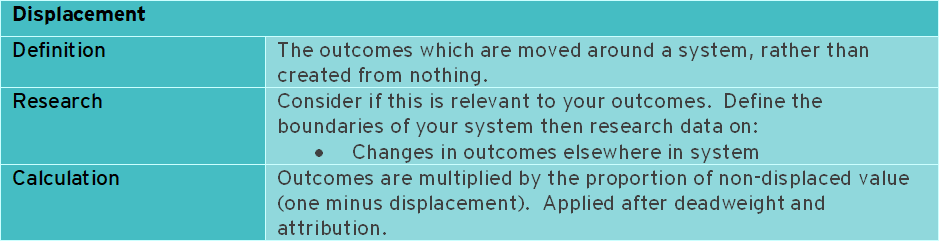
Displacement
Displacement is where one outcome displaces another. A benefit is therefore not created from nothing but instead it is moved around a system. Displacement does not apply to all outcomes, but it commonly affects outcomes in the employability, criminal justice, land use and environmental sectors.
To give an example, one of my clients, a Local Authority, had an issue with youth anti-social behaviour on the streets in the evenings. They decided to provide free cinema tickets to divert young people into a different social activity. After a month of the scheme, anti-social behaviour complaints had dropped, and the scheme appeared to be a success.
However, one small detail had been overlooked. There was no cinema in the local ward where the young people live, so the film tickets required the young people to travel to a neighbouring area.
After going to the film, the young people were sitting down on the streets outside the cinema and drinking and engaging in their normal anti-social activities. In this case, the positive outcome of reduced anti-social behaviour had not occurred at all, the anti-social behaviour had simply been moved to another location.
A similar phenomenon exists with employability schemes. In a market where there are a limited number of jobs, one person’s success in securing a job will indirectly prevent another jobseeker from experiencing the same outcome. Associated outcomes relating to taxes paid, productivity gains, reduced welfare payments and wages received need to be offset to account for these benefits being denied to other stakeholders.
Carbon emissions from driving an electric car are similarly displaced from your personal exhaust pipe to the fossil fuel energy production sites if you are using grid energy. The emissions are less, but if the grid is electrified by coal and gas the emissions still exist, just elsewhere.
To apply displacement, a percentage estimate must be made on the strongest evidence available. In the case of employment outcomes, you may be able to access local output area databases with timely displacement rates. In our environmental example above, emission intensity factors for grid energy could be accurately factored into your calculation.
For other outcomes the data available to support your displacement estimates may be less certain. You may not know exactly where crime is being displaced to, or how the wellbeing of people on a housing waiting list is affected.
You must make a judgement about the reasonable amount of time you will spend researching credible data on displacement depending on its importance to your value story. If in doubt, be conservative and over-estimate the effects so that you can claim you know that “at least” this much impact is taking place.
Calculation
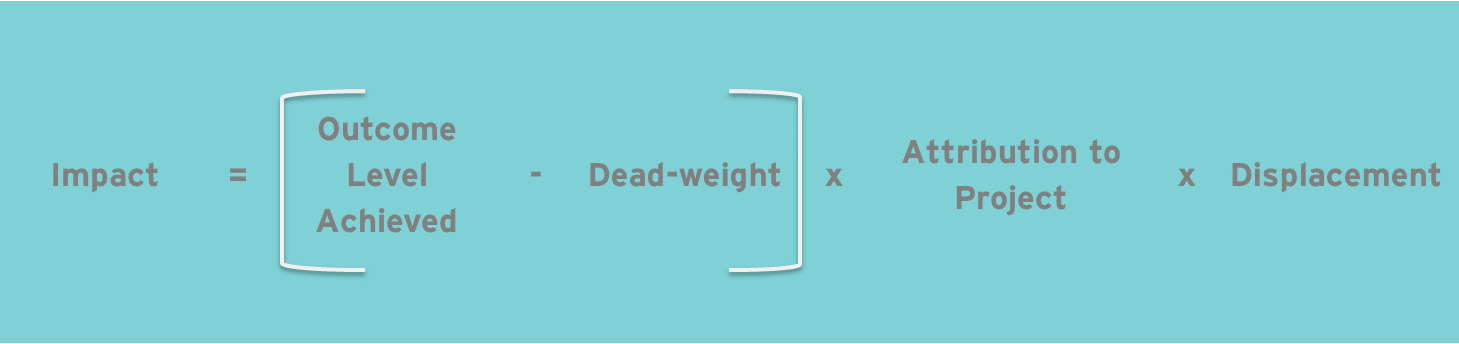
The calculation above is a useful guide for how to combine your outcome and impact data. The exact mathematics will depend on the format and logic of your data.
This calculation works best when deadweight data is in the same format as the outcome level data (for example, both are a percentage of the same population). But if the deadweight data comes from a completely different indicator scale (for example the outcome might be academic outcome data, and the deadweight could be sentiment about how much would have happened anyway) then it is better to multiply the outcome by the deadweight proportion.
Try to take account of any overlap in your impact data. You may adjust your attribution percentages to account for forces which might already be assessed by the deadweight estimate. For example, if the outcome was academic outcomes for girls, and the deadweight was the national average improvements for girls, then some attribution factors like potential help from families might be adequately accounted for in the deadweight.
Ultimately the coverage of counterfactual variables between the three impact elements needs to be assessed on a case-by-case basis, and the calculation adjusted with a clear rationale.
Final thoughts: how to calculate your additional value
Traditional reporting and evaluation approaches fall short of telling you about cause-and-effect. To understand the additionality created by your intervention you need an approach for assessing the counterfactual.
Social Value practice helps you in considering and estimating three elements of your impact. The three concepts of deadweight, attribution and displacement clarify the role of your intervention. They can be measured and applied as part of a calculation, or they may simply form part of the narrative and framing of your outcome data.
Just thinking about these factors will greatly sharpen your impact strategy by revealing external influences and collaborators.